How to work with Ping Tracer — a utility for finding a loss of connection with the server
- Home
- Blog
- Instructions
- How to work with Ping Tracer — a utility for finding a loss of connection with the server
The team of Tucha makes everyday efforts to keep customers' virtual machines running smoothly. But still, occasionally happen situations when a connection with a server is interrupted. The reasons can be different: failures in an Internet provider's network, issues on the side of a cloud service provider, or something with the client's computer (for example, at a level of an operating system).
To find out on whose side the error is and how to proceed, we recommend tracing the route and ping intermediate nodes. Special tools will help you do this in just a few simple steps. In the article, we will look at the most simple and convenient, in our opinion, utility for finding a loss of connection with the server — Ping Tracer.
We would like to remind you that our blog also provides instructions on how to perform tracing in the Windows operating system, but this method is more advanced and requires additional skills from the user.
It is a good idea to use Ping Tracer as a tool for monitoring communication with the server in the background. For best results, we strongly recommend running the utility before starting work with a remote server, rather than waiting for a connection interruption. And at the moment when you experience a connection interruption or slowdown, refer to the Ping Tracer indicators to pinpoint the source of the problem. The results of the tracing will help you identify which connection node is experiencing problems.
While preparing this article, we tested several software products with the corresponding functionality. Not all of them seemed appropriate to us: it was either specialized software, self-written ones without full-fledged functionality, or products that you must pay for.
Ping Tracer has a simple and clear interface. The program itself performs tracing, during which data packets are sent between a local computer and a remote server. The system visually displays the results of the connection check in the form of a graph and shows how many packets were dropped and exactly when along the entire tracing path.
Step 1. First, download the application: when you click on the link, the archive will be automatically downloaded to your device. Next, we unpack the archive and launch the application.
Step 2. After installing the software product, enter the IP address of the remote server in the Host field. We also check that ✔ is ticked in the Trace Route box. After, press the Start button and wait for the system to start tracing. This process may take several minutes.
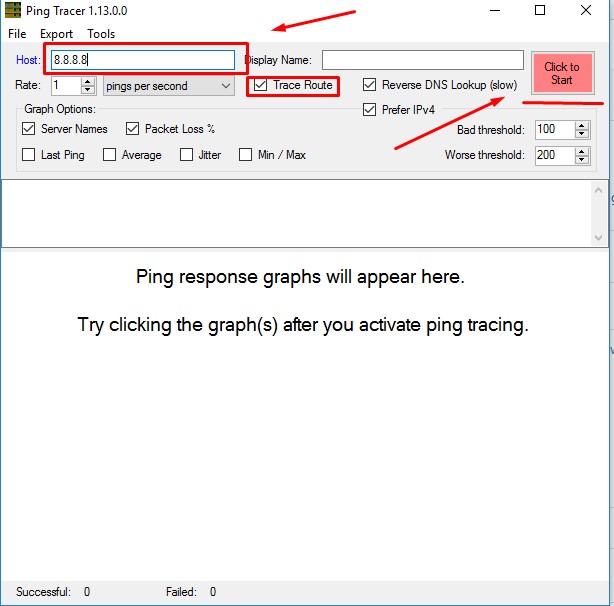
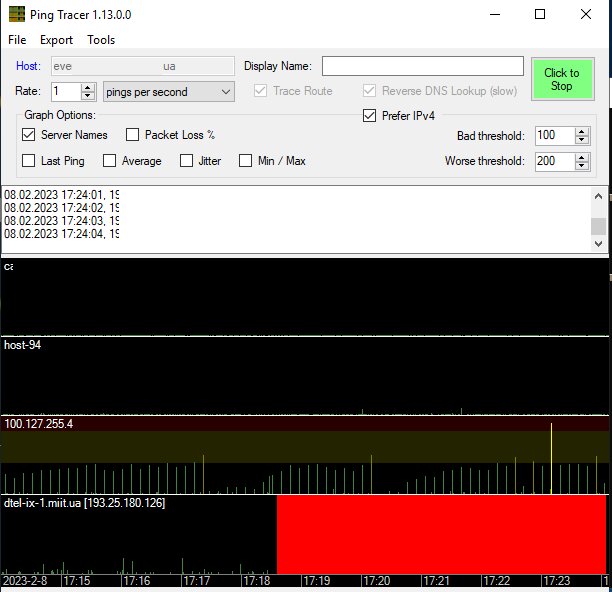
Step 3. After Ping Tracer has traced and pinged the intermediate nodes, a graph with the test results appears on the screen. It shows the availability of hosts along the entire route — from the local machine to the virtual server.
In the example from the screenshot, we can see that there are some packet drops along the route, which are marked by red bars on the graph. Also, in the Failed field at the bottom of the program window, there is information about the number of packets that were dropped during the operation of the application.
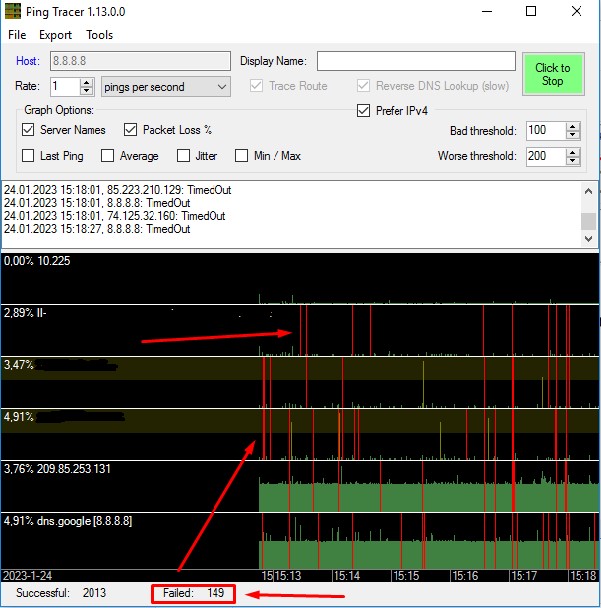
The procedure of finding the loss of connection with the server has been completed successfully. The results obtained in our example most often indicate problems in the Internet provider's network, so in this case, we recommend contacting them.
To find out on whose side the error occurred, you should pay attention to the lines and diagrams that appeared on the graph:
- If the graph shows red vertical lines together with green ones, this indicates the drop of packets, which is associated with failures in the Internet provider's network (as in our example). Also, sometimes such a result can indicate issues that have arisen on the user's device. Packet drops typically lead to slowdowns and freezing of the image when working on a remote server or frequent connection interruptions.
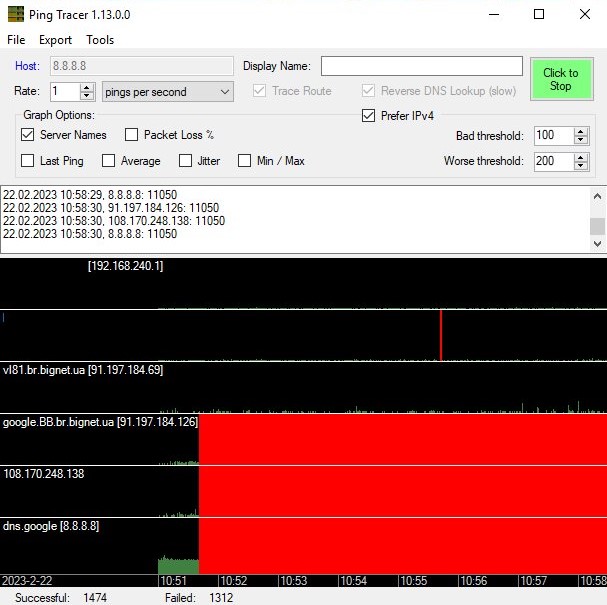
- Solid red charts on the graph illustrate a communication break in the middle of the route, which can also cause connection problems. And although this is not often the case, you should contact your Internet provider, who will most likely try to change the routing.
- Stable green diagrams at all trace steps mean that there are no issues accessing the virtual machine, both through the Internet and from the server itself. Identifying the location of the communication breakdown requires additional diagnostics.
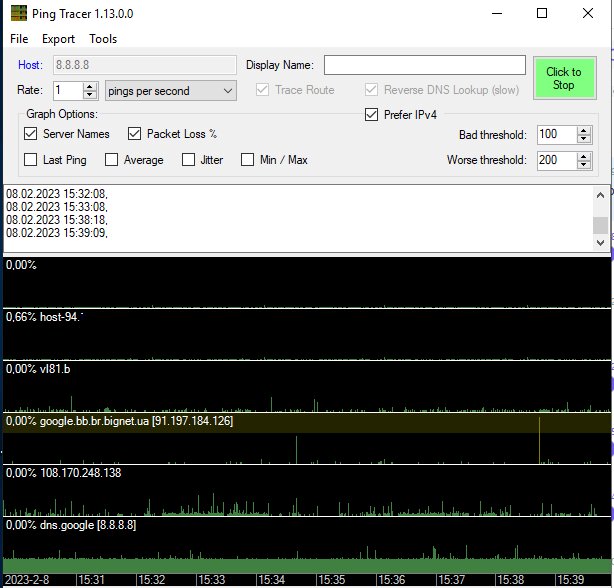
- And if there are stable green charts on all steps, and a red chart on the last one, we recommend contacting your cloud provider, as this result may indicate connection failures directly from the server itself.
- If the intermediate nodes do not match
The absence of a response from any intermediate node (or even several) does not always indicate the presence of a problem. In this case, it is necessary to pay attention to what is happening behind the node that does not respond. If other nodes respond normally after it, then the absence of responses from this node does not mean anything.
Explanation: Not all Internet routers process diagnostic requests. Some of them process only a certain percentage of such requests, and some do not process them at all. It is quite normal when, during a tracing process, we see properly responding nodes after those that respond occasionally or do not respond at all.
- If the virtual server does not respond
Occasionally, the processing of diagnostic packets is prohibited directly on the end server, so the question arises whether this server should respond to diagnostic requests.
Explanation: If the server itself is not responding, and it is located behind a virtual router, you should check the virtual router settings. The user can do this independently in the server control panel settings or contact their cloud provider. If the server has a direct connection to the Internet (without a virtual router), in this case, it is necessary to check the firewall settings directly on the remote server.
Of course, there are many tools for detecting server connectivity issues. You can work with those that you like, or use our visual and proven instructions.
In any case, if you need help solving technical difficulties, our support team is always there. Email us at support@tucha.ua or call +380 44 583-5-583.


