The connection to the server is lost. Tracing and ping
- Home
- Blog
- Instructions
- The connection to the server is lost. Tracing and ping
"Help, all is lost!". If your inner voice reacts to a broken server connection like this, this material is exactly for you. :) Of course, from our side, we do everything possible every day so that nothing interferes with your work in the cloud, but if force majeure happens, we will figure it out. To take in the situation quickly and understand on which side the error is, route tracing and pinging the intermediate nodes is the minimal thing that you can do. How to do this, we will tell you now.
Route tracing
During tracing, data packets are sent between the local computer and the server. This helps to trace the path of the request to the server and determine at what stage the break occurs. Tracing is easy to do.
- Run the command cmd: Win+R > type cmd > ОК.
- In the command prompt type tracert X.H.H.X (where X.H.H.X is the IP address of the server or domain), and press Enter.
In the example, we traced google.com.
tracert google.com
Here is the result:
1 2 1 ms 1 ms 1 ms 193.151.89.254

3 5 ms 4 5 1 ms 6 1 ms 7 1 ms 3 ms 1 ms bearline-ic-324086-ffm-b4.c.telia.net [62.115.153.215]

8 1 ms 1 ms 1 ms 108.170.251.129

9 13 ms 13 ms 15 ms 66.249.94.135

10 13 ms 13 ms 13 ms fra15s12-in-f46.1e100.net [216.58.208.46]
As you can see, our packages came through ten (there may be fewer or more) nodes and did it successfully. Otherwise, if the packets "stumbled" on one of the nodes, on it (and on subsequent nodes) we would see:
* * * The waiting interval for the request has been exceeded.
But even in this case, it is not time for conclusions yet – this entry can mean a packets loss and the fact that the network node is simply closed by security settings. Sometimes providers to reduce the load intentionally configure nodes so that they do not respond to tracing packets. To make sure that the break is happening, and if it is, where exactly, you need to ping each of the nodes. When tracing, we got the IP of each node, which means we can ping.
Ping of intermediate nodes
Ping is designed to check the integrity and quality of connections. Also, it is easy to perform. At the same time, you need to ping all intermediate nodes in separate windows. So, at the moment of the connection breakage, it will be seen at which node packet losses happen and how long these breaks last.
In Windows, by default, only four packets are transmitted, which is not enough if the problem reveals itself briefly. Therefore, you need to remove this restriction with the -t parameter (to stop the packet exchange, press CTRL+C).
Let us talk in more detail.
- Run the cmd command: Win+R > type cmd > OK.
- In the command prompt, type ping -t X.H.H.X (where X.H.H.X is the address of one of the intermediate nodes that we identified during tracing), and press Enter.
In our case, when tracing, we identified ten nodes, which means that the ping must be performed ten times in ten separate windows.
Useful!
If you need to constantly monitor connection quality, you can use a convenient program for Windows called PingPlotter.
So, let us ping – in ten separate command-line windows, we enter commands with the IP addresses of the nodes that we identified during tracing. In our case, there will be such commands:
ping -t 10.1.1.1

ping -t 193.151.89.254

ping -t 85.195.75.129

ping -t 213.248.79.29

ping -t 62.115.139.50

ping -t 62.115.120.8

ping -t 62.115.153.215

ping -t 108.170.251.129

ping -t 66.249.94.135

ping -t 216.58.208.46
If in any of the windows from the very first seconds you see "The waiting interval has been exceeded", do not hurry to shout, "Gotcha!". If these nodes are pinged normally, then this one is simply closed by the settings. In our case, for example, the pre-last node (66.249.94.135) immediately says that the interval has been exceeded, but there are no problems with the ping of the tenth node.
What is next? After ping for all nodes has been started, leave it until the next break. As soon as it happens, go back to the ping windows to identify where is the fault and what to do.
Which side is the mistake?
So, the break happened again. But this time launched ping of intermediate nodes will help to "expose" the culprit. Everything is simple here – from which node you started to get "Exceeded the waiting interval" is the weak link.
It is clear where the problem is, now we need to understand what to do in specific situations.
1. The last node. If the last node pinged normally at first (some Windows machines do not respond to ping at all, it can be configured in the firewall settings)…

...and after the break, it began to show "The waiting interval has been exceeded", the break is on your server.

In this case, go to the control panel, launch the console, and log in to the operating system to figure out why the server is not working. If it turns out that the operating system is hung up, restart the server.
2. Any nodes except the last one. In this case, contact a cloud and Internet provider technical support services. Also, specify how the route tracing initially looked like, and make a list of nodes on which ping was interrupted during the break and on which ones were not. Be careful, this is vital information, make no mistake.
3. All nodes simultaneously. If all ping windows show "The waiting interval has been exceeded", the problem is in your computer or the network to which it is connected.
Bonus!
Well, to make you feel comfortable, we have picked up utilities with which you can trace and ping intermediate nodes in one simple movement without launching fifteen different windows.
For the Windows OS family, this optimization is conducted by the Winmtr utility. It does not need to be installed and is ready for use immediately after unpacking from the archive.
You can download the utility here.
Unpacked, launched, what is next?
In the Host field, specify the destination server with which the connection will be checked, and click Start:
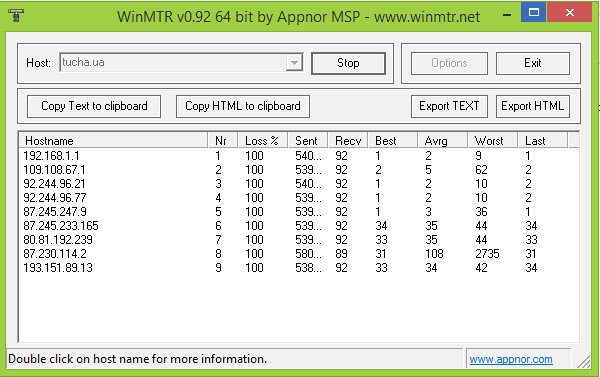
In our example, the route trace and all intermediate nodes are visible. At the same time, ICMP packets are sent to each of them, which can be used to determine the quality of communication.
This is the main advantage of the utility – its output is constantly updated, it allows collecting statistics, tracking averages, trends, and any changes in network quality.
Since we are checking the connection with the server, we are interested in the columns Sent (packets sent) and Recv (packets received). If the values in these columns do not match, it means that the quality of communication with the node has worsened. What to do? Contact the appropriate technical support.
The Loss column will help you view the dynamics of losses in percents.
The utility also allows copying the text in convenient formats (.txt and .html) to the clipboard (Copy to clipboard) or a separate file (Export).
Double-clicking on the intermediate node will allow you to get additional information about it.
It is important to know!
To detail the problem, technical support specialists can request additional pings with special settings. To do this, it is enough to enter them in the Options window, which will allow you to specify:
- Interval (sec) – data update time in seconds.
- Max host in LRU list – the maximum number of hosts (or IP addresses, if the Resolve names option is not active) to the endpoint.
- Ping size (bytes) – an ICMP packet size.
- Resolve names – the ability to convert an IP address to a hostname.
What about Linux users?
For the Linux OS family, the utility is called MTR. If it is not in your operating system, you can install it in one of the following ways:
Debian/Ubuntu/Mint:
$ apt-get install mtr
CentOS/RedHat/Fedora:
$ yum install mtr
MTR has the same functionality as Winmtr, as well as a similar graphical interface. You can run the utility using the command:
mtr X.X.X.X
where X.X.X.X is the IP address of the destination server or the hostname.
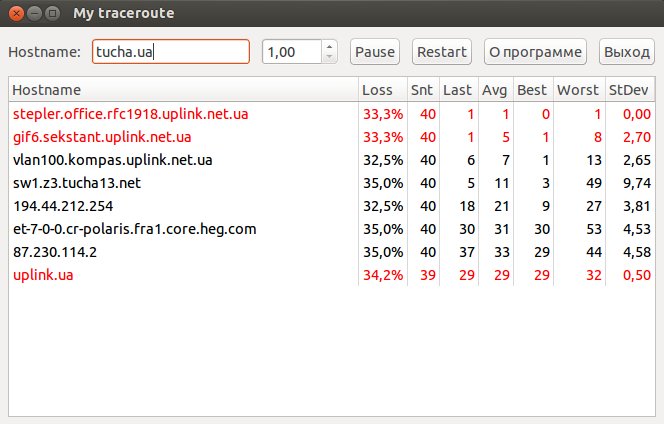
In this case, look at the following columns:
- Loss% – the percentage of lost packets between the sending computer and the intermediate nodes.
- SNT – the total number of packets sent.
When something is lost somewhere, the utility signals us about it by coloring the node in red and calculating the percentage of losses.
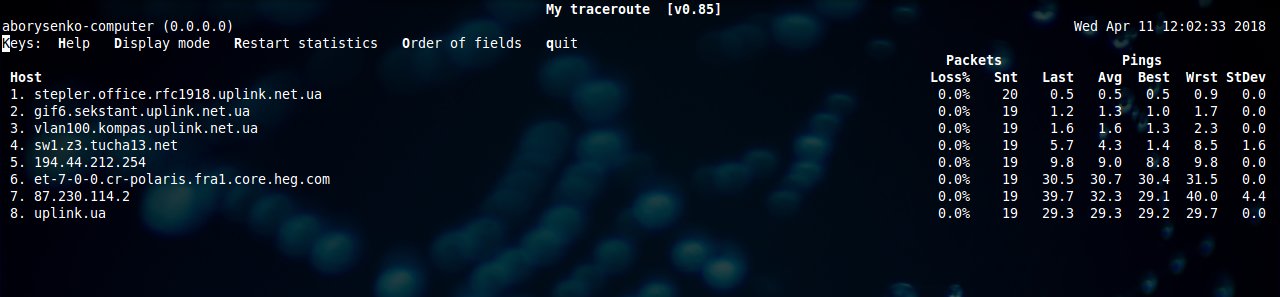
Also, we note the possibility of launching the utility in text (console) mode. To do this, just add the -t or --curses option:
mtr --curses tucha.ua
Let us look at a few more important MTR options that can be extremely useful in the process of network diagnostics.
-r или --report
Starts the report mode, in which MTR will process the specified number of cycles (defined by the -c option), and then display statistics and automatically shut down. This mode is useful for collecting statistics on network quality.
-c COUNT или --report-cycles COUNT
Indicates a number of cycles after which MTR will shut down.-p BYTES или --psize BYTES
Sets the packet size in bytes.-i SECONDS или --interval SECONDS
Sets an interval between sent packets.-n или --no-dns
Allows not to use DNS, displays IP addresses of nodes.-a X.X.X.X или --address X.X.X.X
Allows you to specify a computer interface address from which ICMP requests will be sent.
Summary
Of course, the commands in the console give a more accurate result, since they record even single packet losses (short breaks), but Winmtr and MTR are compact and more convenient. And what to choose is up to you. :)
This is it. We have found out what the problem is and what to do :) We hope the material was useful to you, and if you have any additional cloud-related questions, please contact us for competent advice 24×7.