How TuchaKube works — the first Ukrainian DevOps/Hosting platform
- Home
- Blog
- Cloud Services
- How TuchaKube works — the first Ukrainian DevOps/Hosting platform
We continue to get you acquainted with powerful features of the service TuchaKube. In the previous article, we wrote about how appeared the idea to create a platform for automating CI/CD processes, hosting applications and their data in cloud containers, as well as what it consists of and what tasks it solves. In this article, we will tell and show exactly how the innovative solution works.
The automation of CI/CD processes is carried out according to certain templates developed by us, which are flexible and can be customized to the needs of a specific customer.
Step 1. A developer first does commit to a local git repository and then does push to a remote git repository in a separate GitLab, which is provided to the client. This action is the trigger to start a build process if no other parameters are set. If the developer does not have the right to deploy to the current branch, then the developer executes a merge request, which is processed by those who have such rights.
After the changes made by the customer fall into a branch that requires executing of automatic processes, analyzing of the code and updates are carried out.
Step 2. Then containers based on our Docker files are automatically created. Since we already have an accumulated library of standard Docker files, they require the least number of refinements to be used in work.
The containers creation is conditioned by the direct functioning of the platform: it requires all applications and components of the customer's software to be executed in containers.
The container is pushed to a local repository (for example, a repository of containers provided to the client by GitLab) or remote (for example, Docker Hub or any other docker registry).
Step 3. After that, testing is performed. This means that the system launches one or more containers in one of the cloud’s "corners" and performs with them what is prescribed by the developer in the automatic testing program. Note that the algorithms are compiled exclusively by customers (personally or with the help of QA engineers).
Step 4. Next is the process of deleting redundant data. In some cases, recompilation occurs. Also, after that, testing is sometimes performed again.
Step 5. The next step is to deliver the new version directly to the staging environment. This process happens like this: containers with a new version are launched first. Then, when the system has made sure that the containers are working properly (for this, so-called readiness probes are usually performed, which allow determining whether the Pod responds correctly to requests), it switches traffic to new containers, and gradually turns off the old ones.
So, there is an automatic update in the staging environment
1. The customer makes a specific commit.
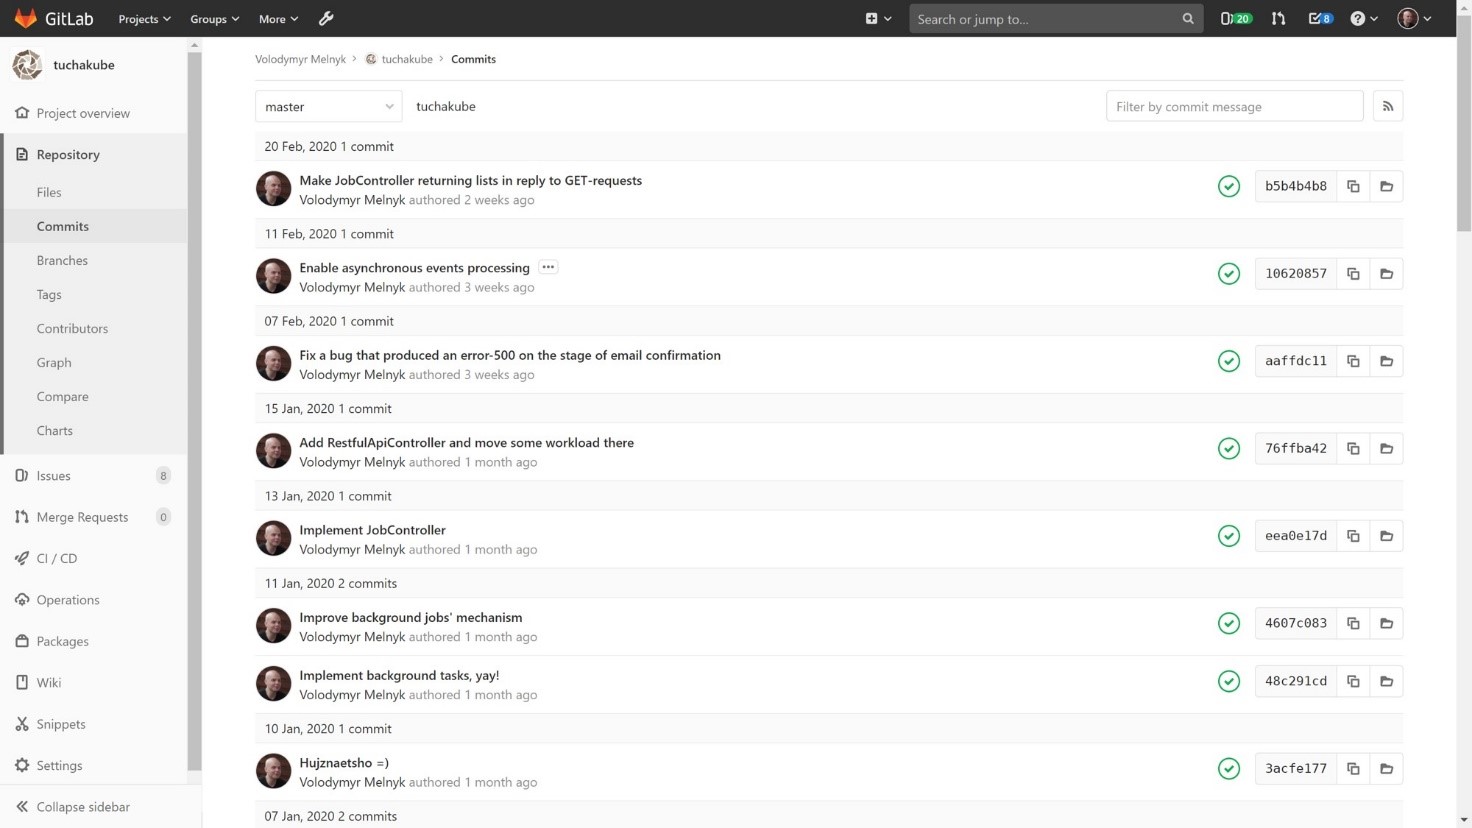
2. An identifier is assigned to the commit. In the future, it will be used to track all the actions and changes that will happen with this process. Testing is also performed with the indication of this unique identifier.
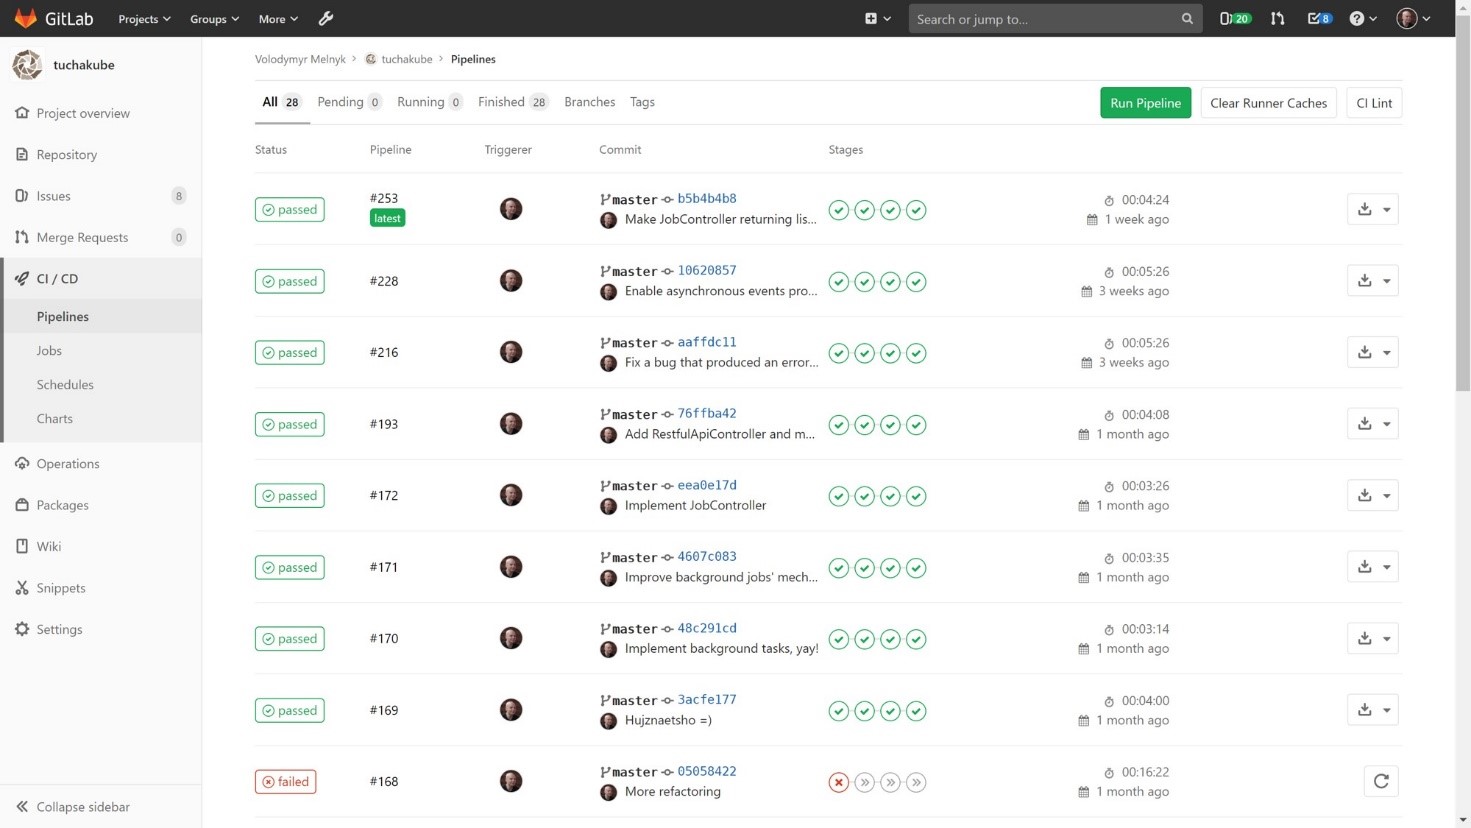
In other words, as soon as the customer makes a commit that meets specified criteria (they are determined by a DevOps engineer in the CI/CD process configuration file of a specific project), it will be automatically and immediately performed in several stages. These stages are set by us based on the customer's wishes:
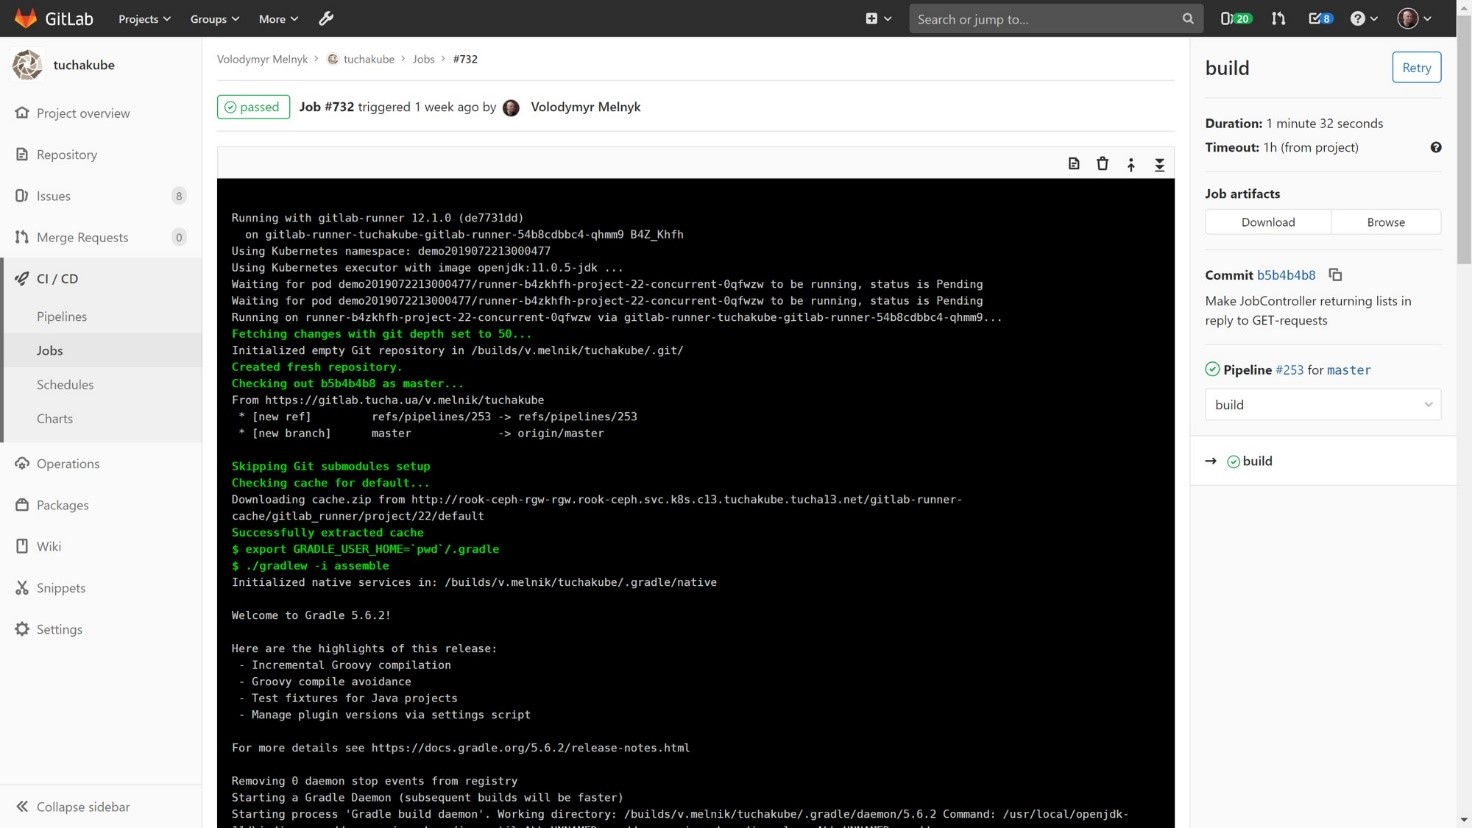
1) Building (compiling) the project.
The project is compiled in such a way that you can first see if there are certain libraries cached from the previous compilation that may be useful to us since compilation (like all further processes) happens in separate containers. Since the container is a "clean" system, which is empty inside, when performing each step, it takes from our local S3-compatible storage the data that has been preserved from the preliminary workings. This process is necessary because the project that will be compiled needs to collect a large number of libraries and distribute them. Thus, working data and libraries are stored in S3-compatible storage so that they can be used then.
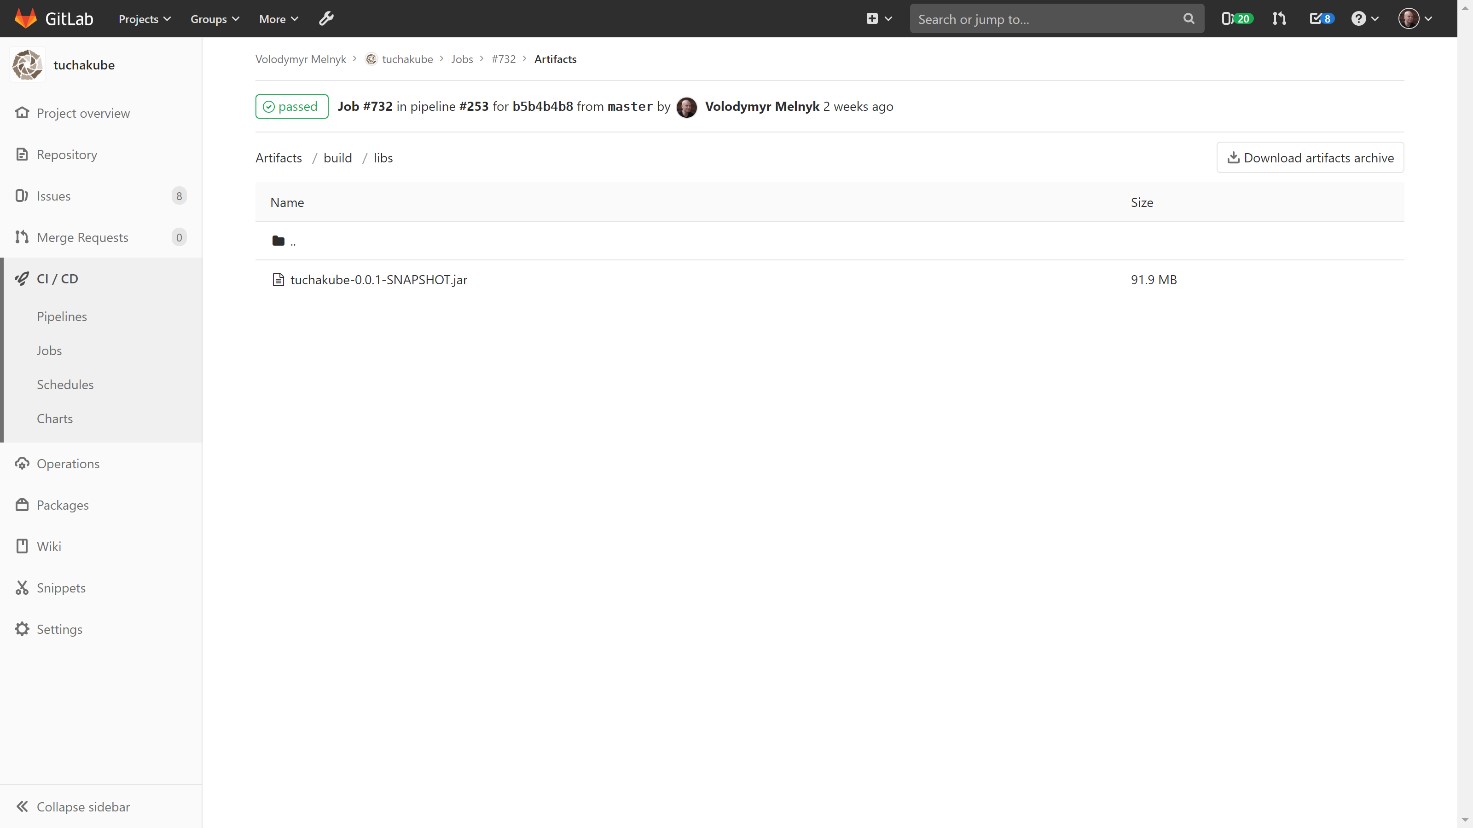
In addition, artifacts are also saved (any files that the developer wants to save after the build), which we can then use for work.
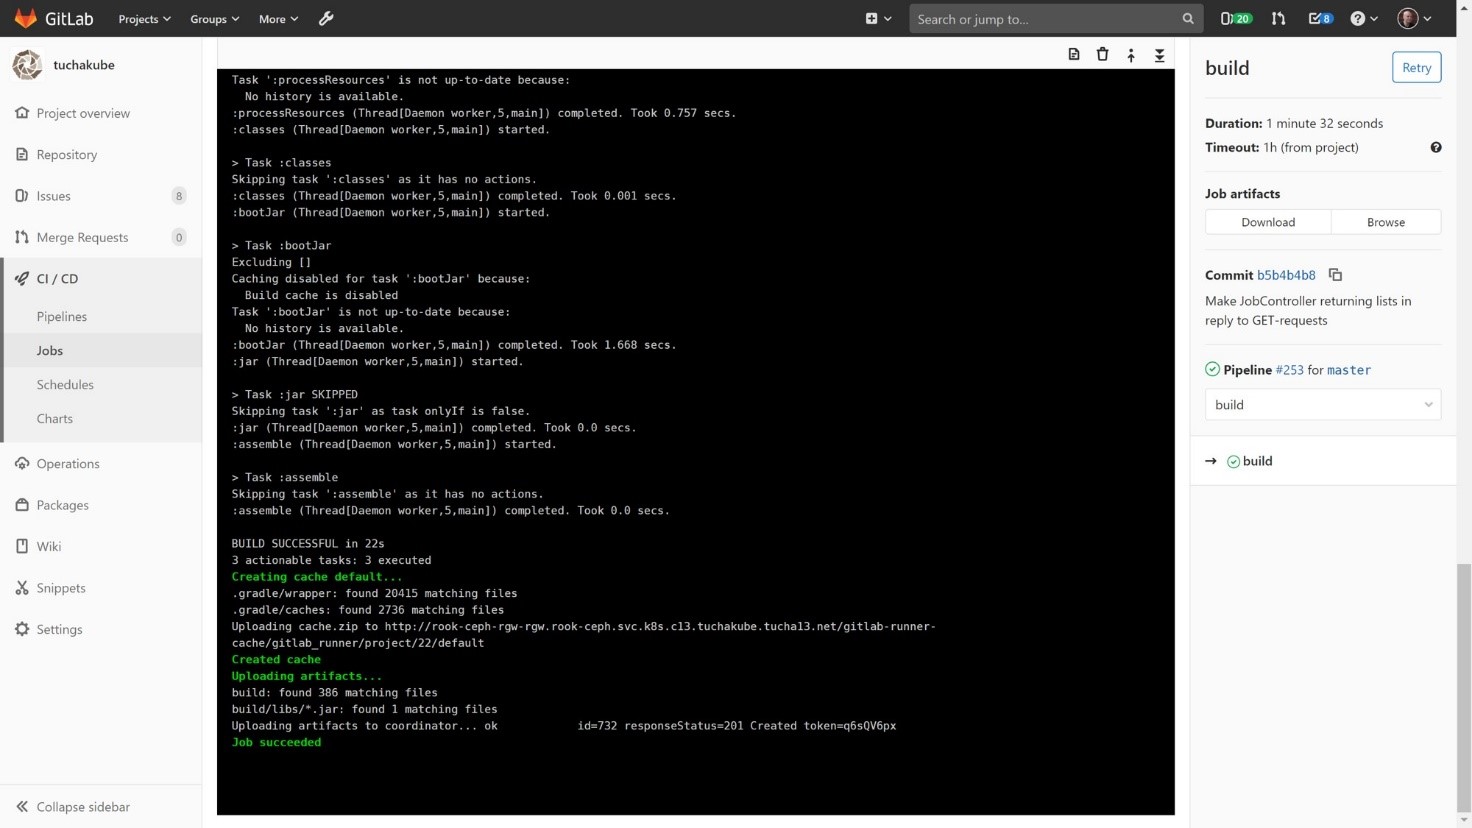
In the artifact repository, it is possible to look into the artifacts for each build and see what is in the artifact repository for each identifier. Each commit contains its unique identifier.
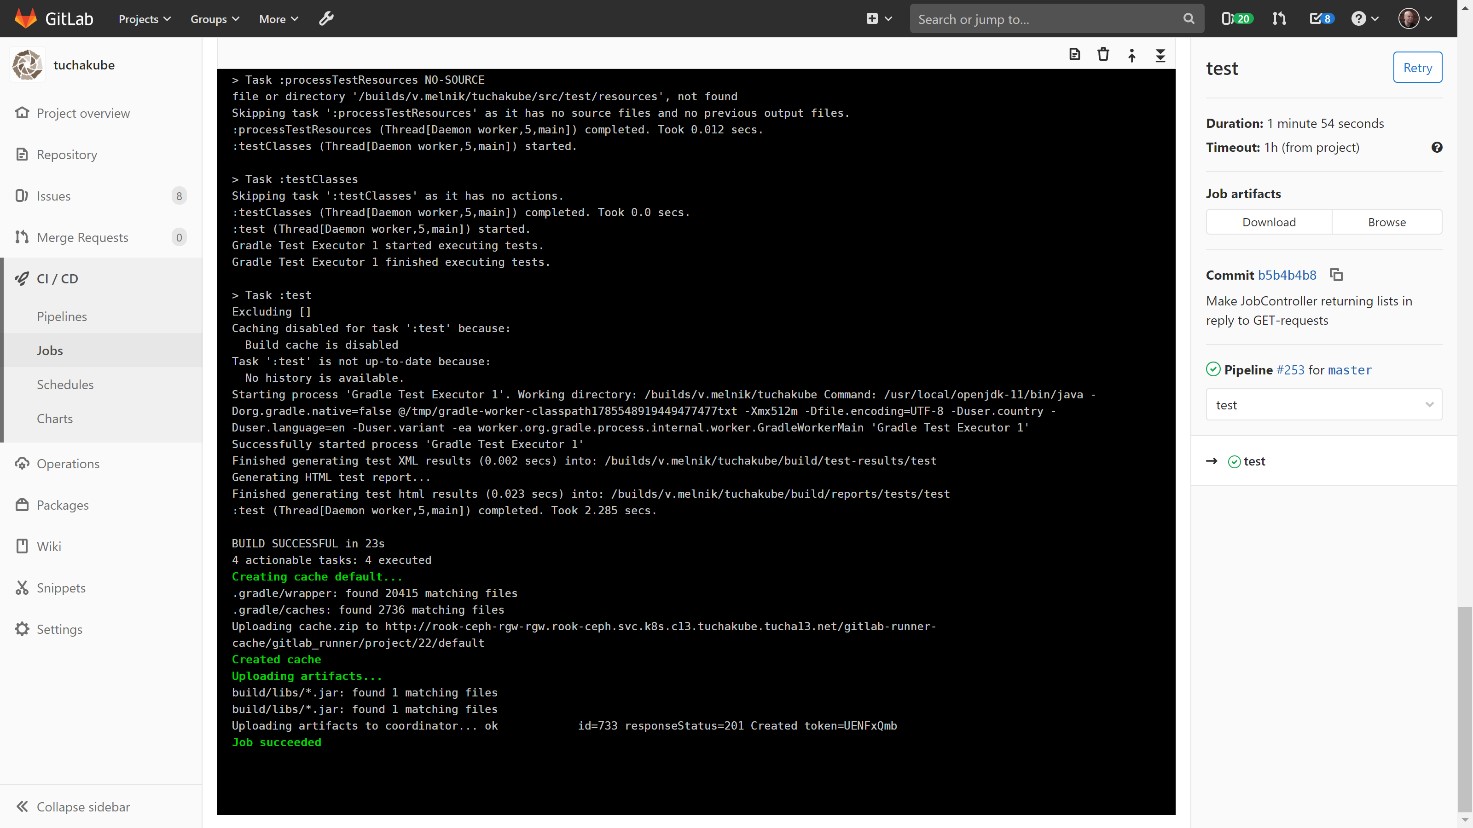
2) Testing.
This process also happens with the indication of a unique identifier. In the same way, artifacts are restored (important), and working data is restored (not always necessary).
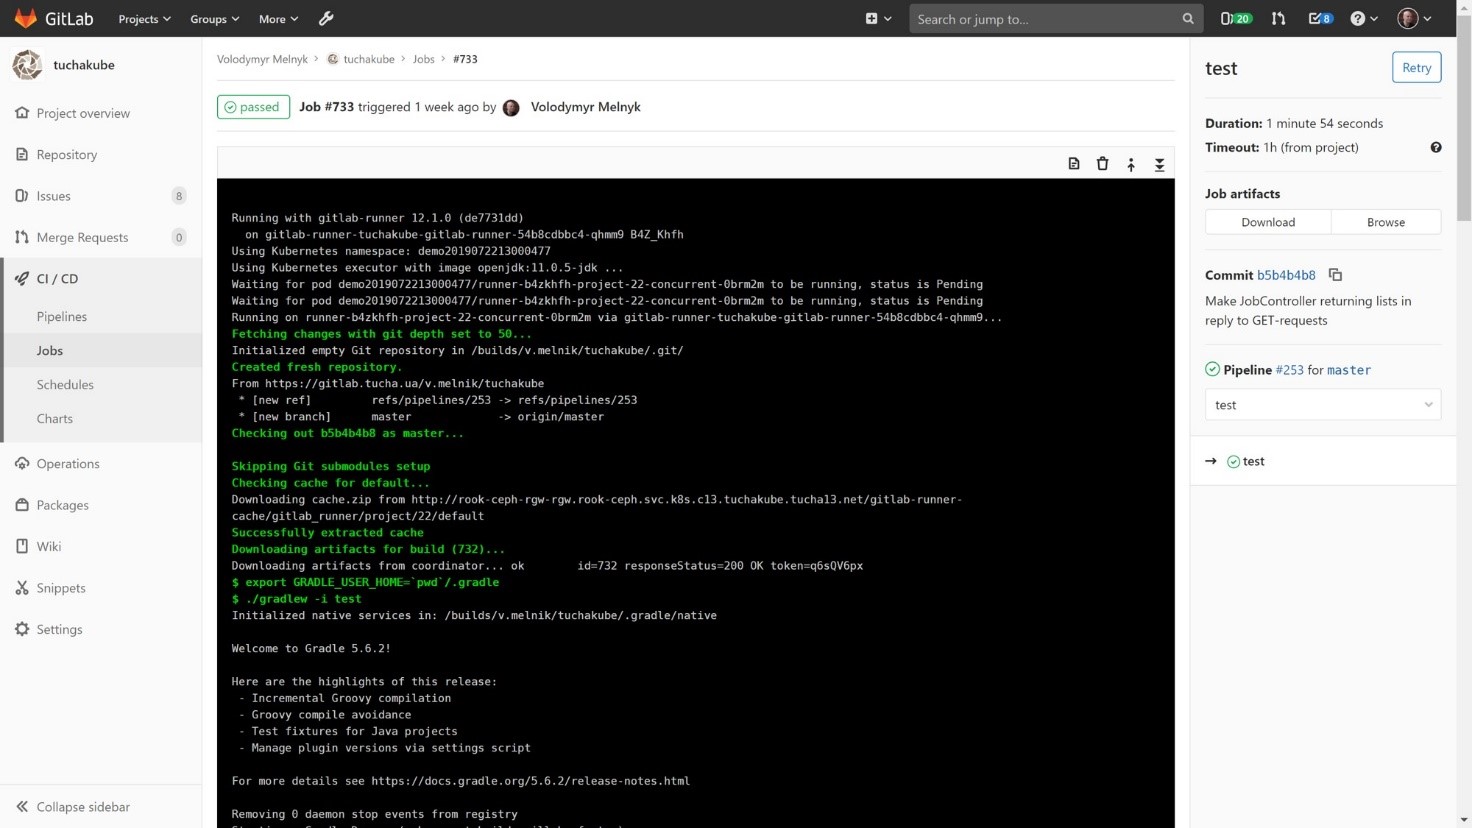
After the automatic testing, it is time to save the working data again, if necessary. Note that after testing, artifacts usually do not change.
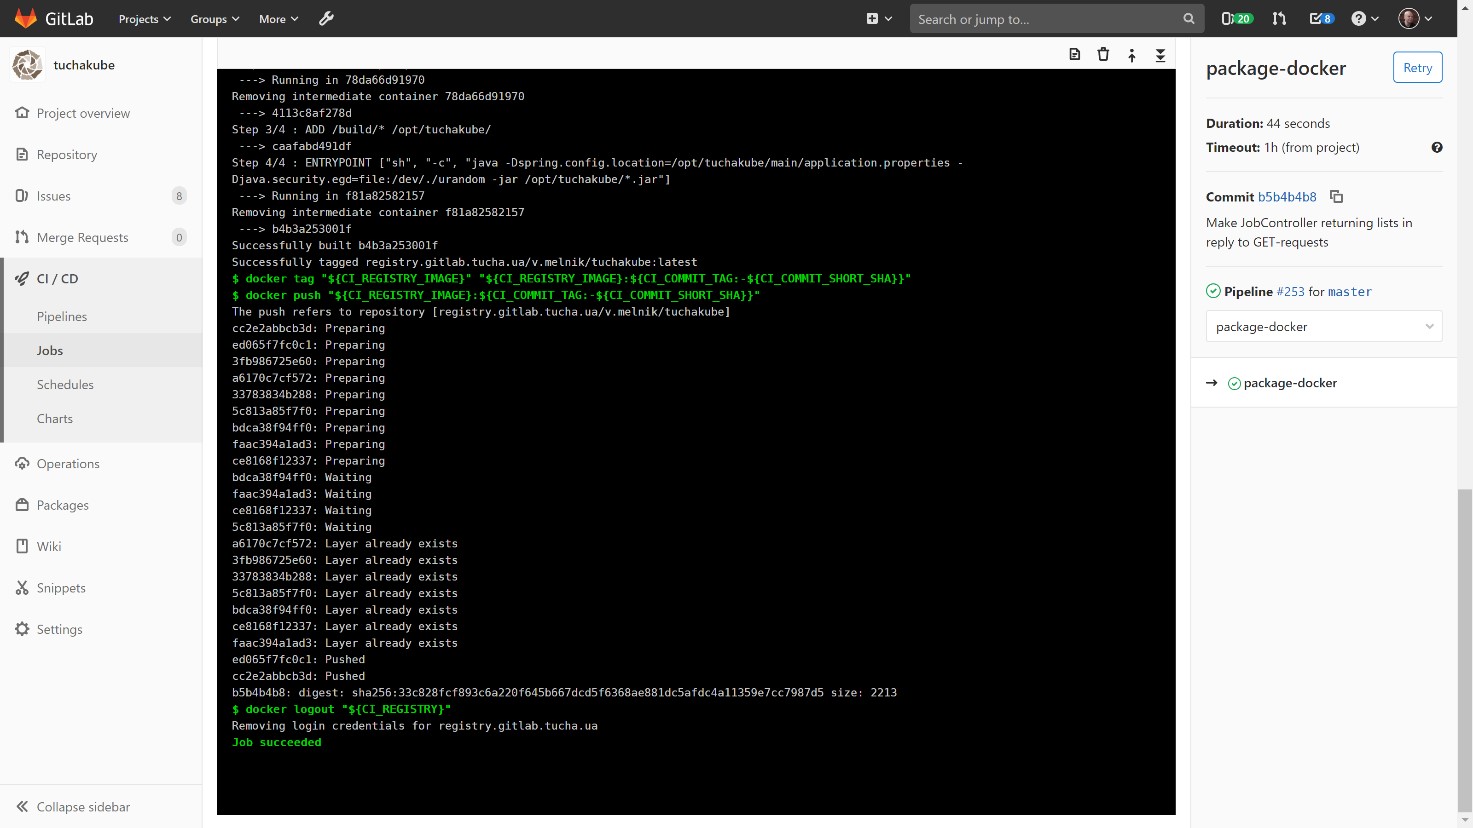
3) Containerization.
With the same identifier, we are building a container based on a Docker file that we created for a component of this project.
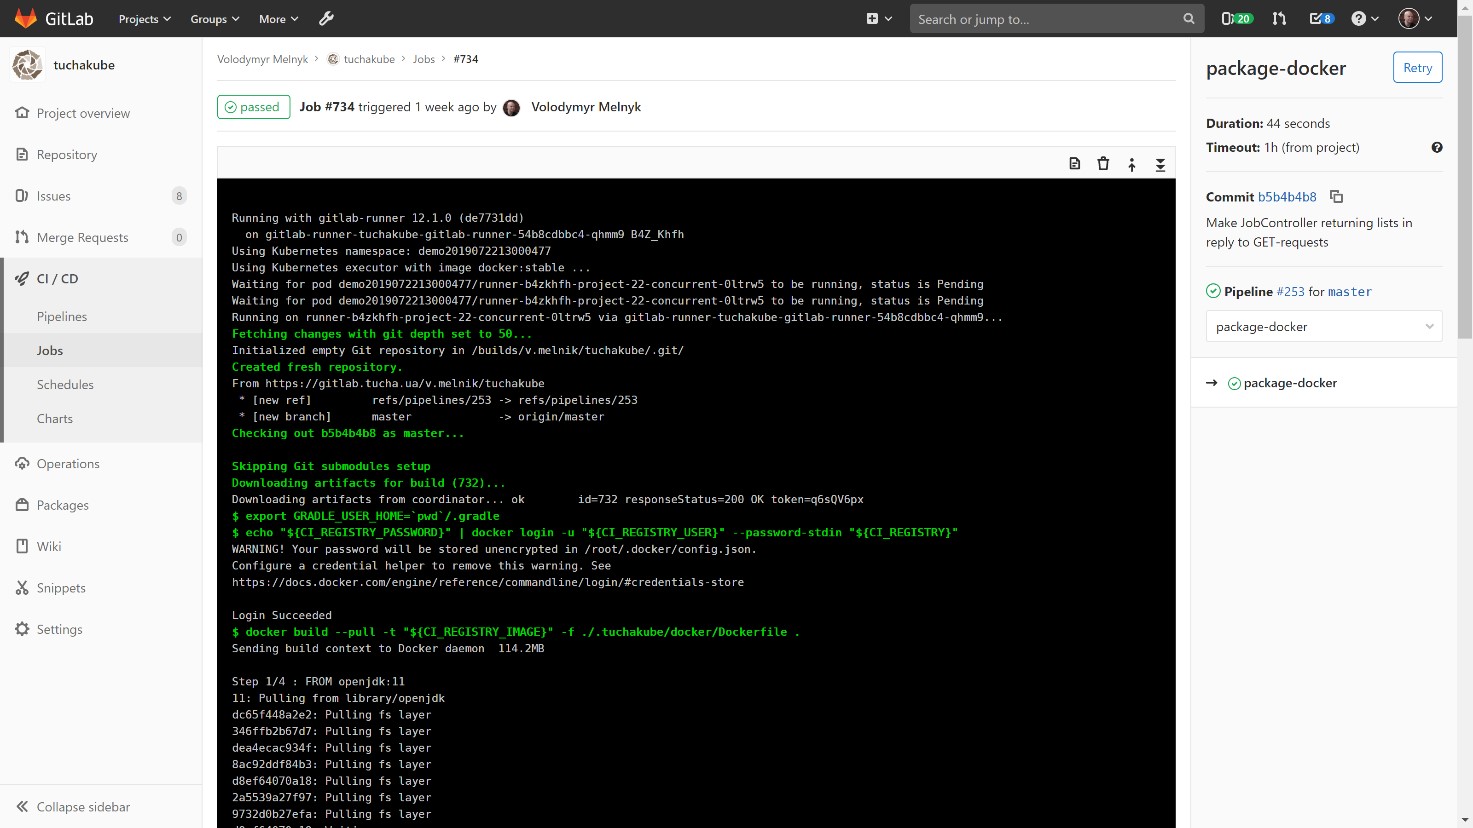 The assembled Docker container is stored in our local storage, Docker Registry, which also belongs to the client.
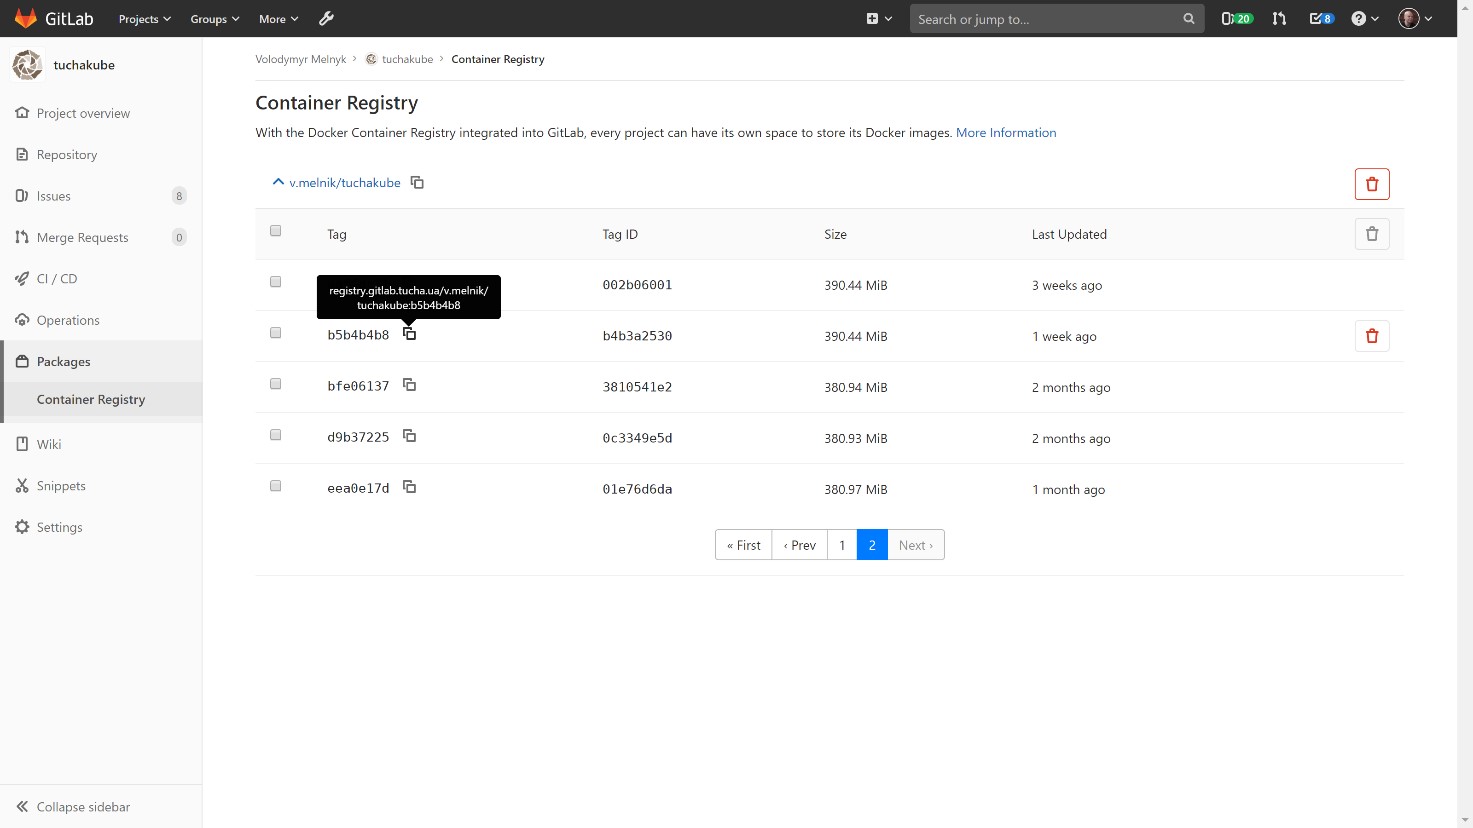
The customer can look into it and see which containers exist, which versions they have and what is inside, as well as delete some data if necessary. You can also set algorithms for automatic deletion (usually data is stored for 14 days).
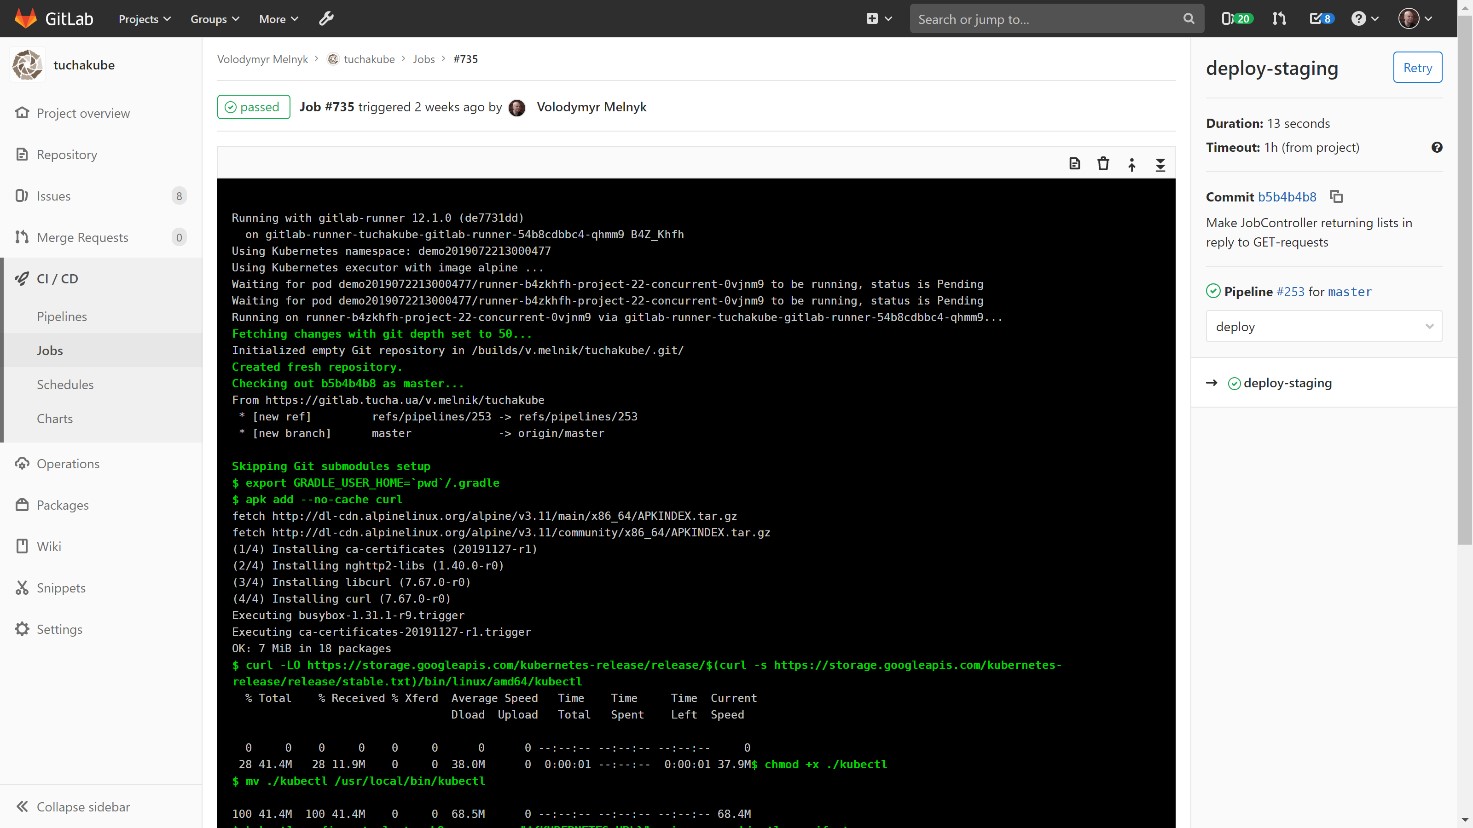
4) Delivery of the container to the staging environment.
After the container is assembled, it is delivered to the staging environment. We suggest performing these actions in the staging environment first to personally verify how the new version works at a separate address.
Next, a deployment manifest for Kubernetes is usually created, which also contains the ID of this commit (at the same time, it is also the ID of the Docker image that will then be used).
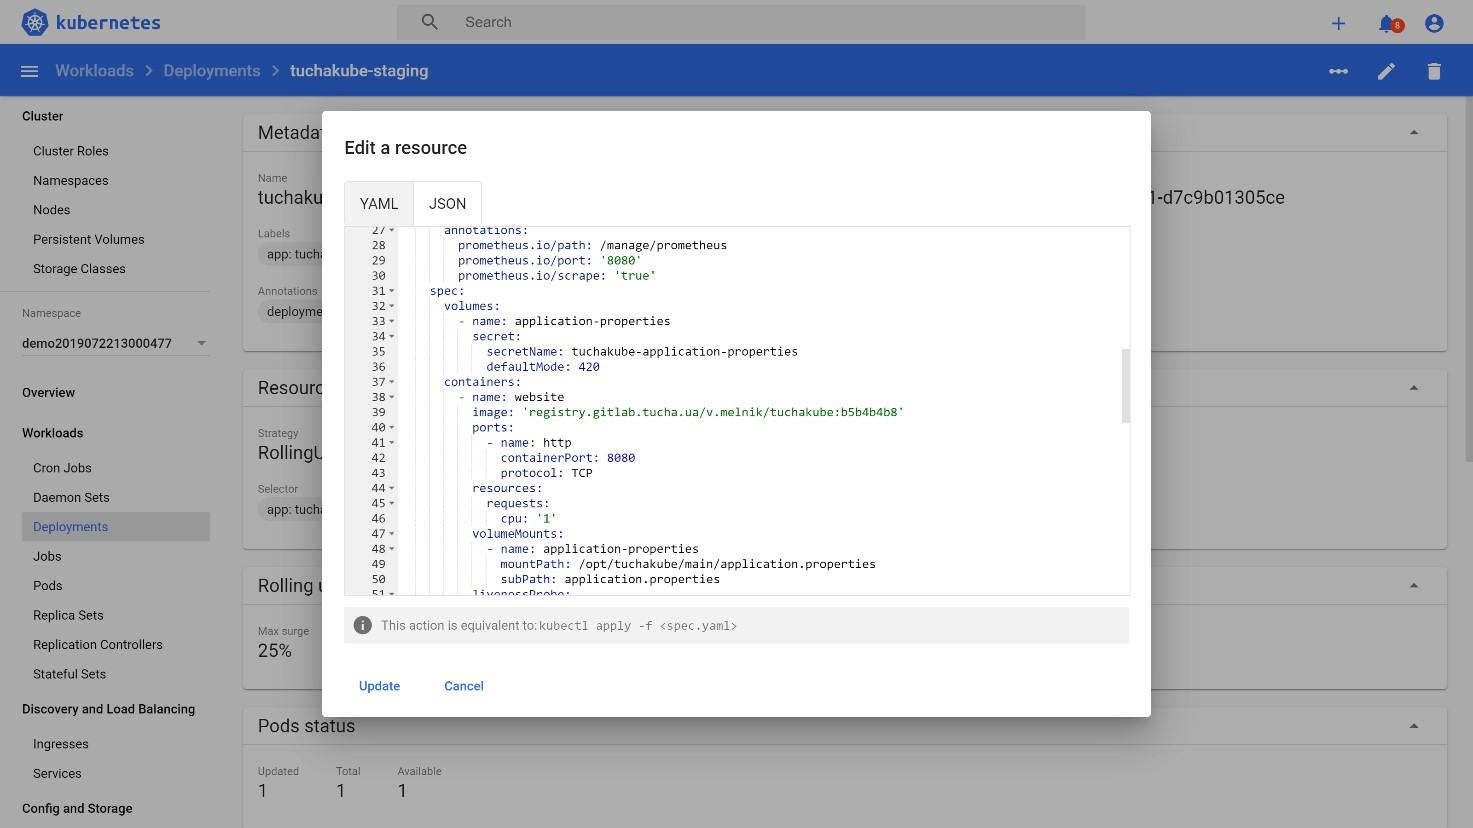
That is, a manifest that contains this identifier is automatically created. The access details required for authorization to the repository are usually stored inside the Kubernetes cluster in the form of special entities called "secret".
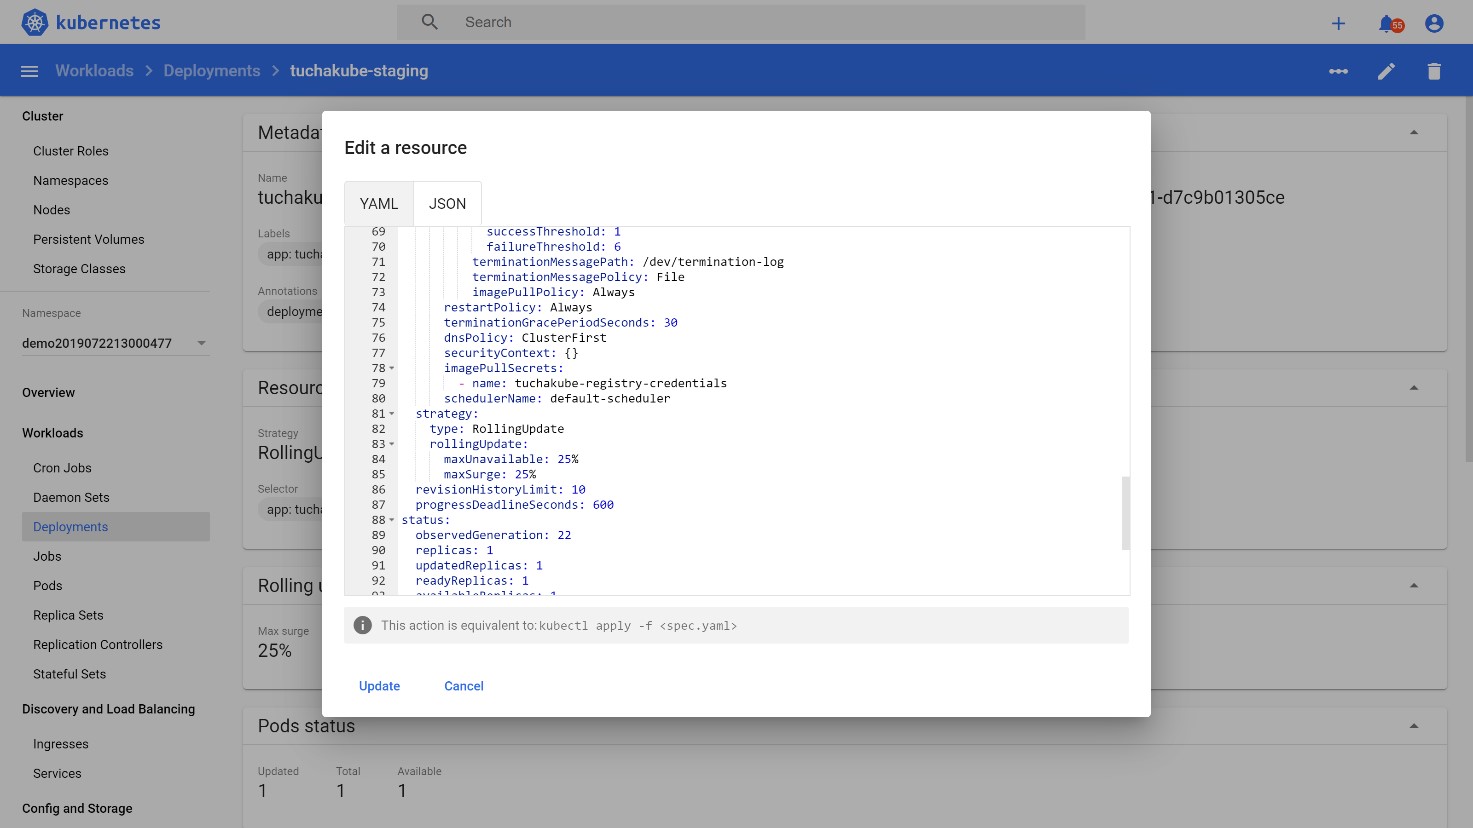
Then all this will be deployed to the staging environment as a separate version of the same deployment, but with updated containers inside the Pod.
First, Pods with containers in the required number are launched in the Kubernetes cluster, but traffic is not delivered to them. Traffic starts coming to them when Kubernetes makes sure that this traffic will be handled correctly. That is, it performs testing: for example, it checks the availability of the application inside through the port on which it is running. If the reaction is as expected, Kubernetes starts switching traffic to it.
5) Updating in a production environment.
This stage happens after we have made sure that everything is working properly in the staging environment, and the QA team has processed its manual testing algorithms and is satisfied with the results.
When updating in the production environment, the same action occurs as during the delivery of the container to the staging environment — merge is performed into the branch, which is the master branch or one of them. There is only one small difference: the final stage is performed manually. It means that, after the developer or another authorized person is convinced that everything is working well in the staging environment, they simply start this stage by pressing the Play button in the pipelines. That is, the final action is performed manually, not automatically.
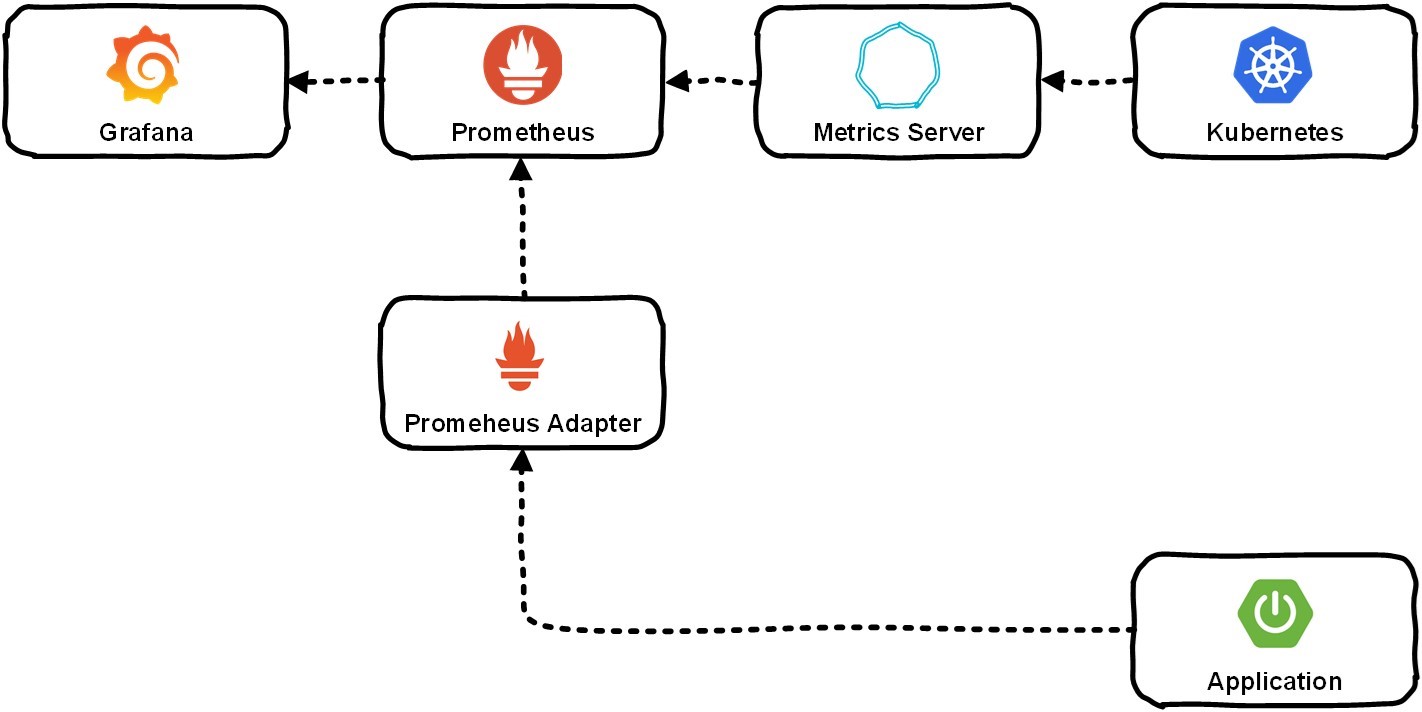
To be able to monitor and scale horizontally, we needed to collect a variety of data: both from the application that the customer is developing, and from the Kubernetes system. Often, through the Metrics server, this gets into Prometheus, and it already stores information about all metrics. In the future, the user can view them using Grafana.
Let us look at the example of the specific application.
Situation 1. Requests are not received.
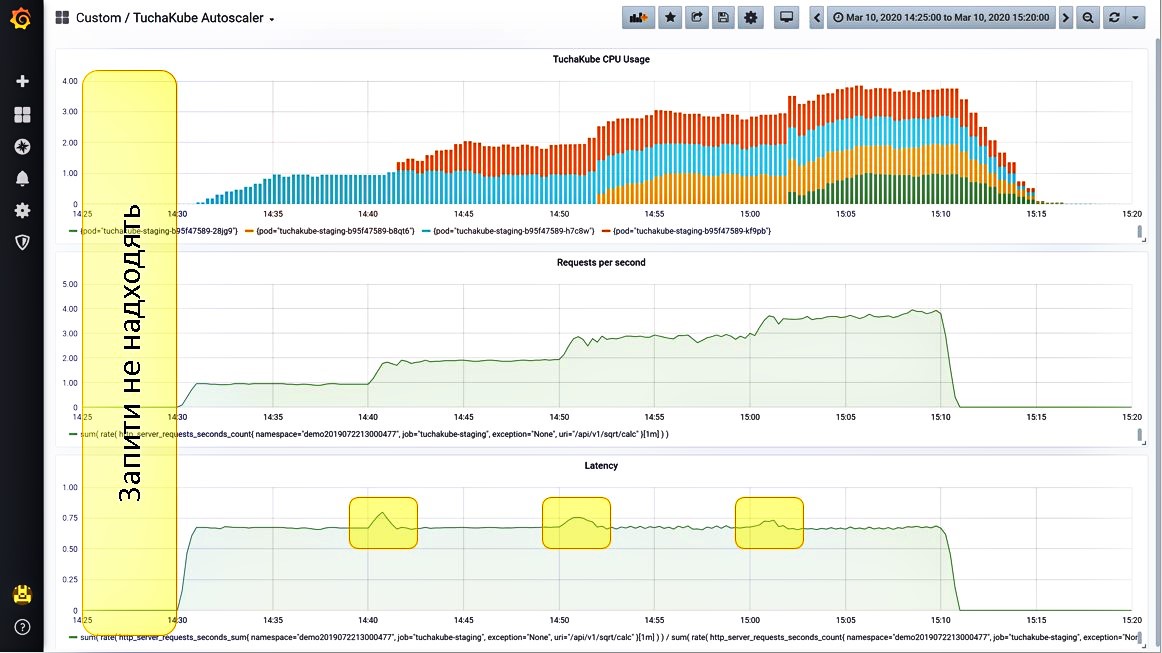
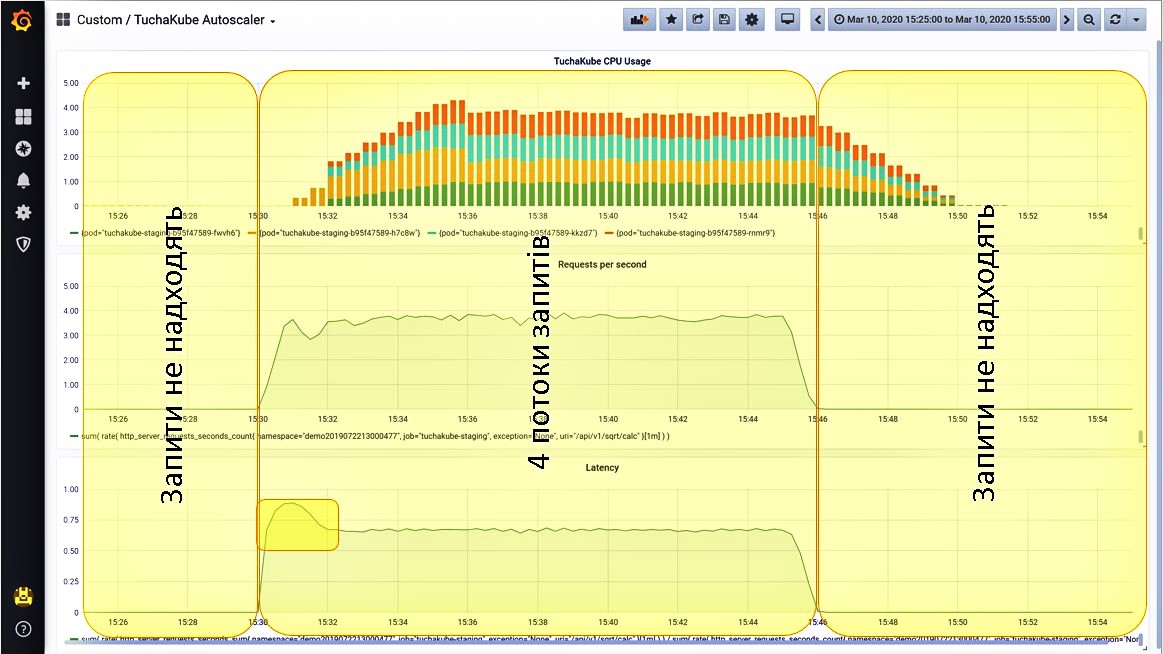
We have brought 3 metrics to Grafana, which are monitored in the platform TuchaKube:
- CPU utilization (blue bars);
- the number of requests per second coming to this service (yellow bars);
- the delay that occurs when processing a single request (green bars).
Situation 2. We give one stream of requests.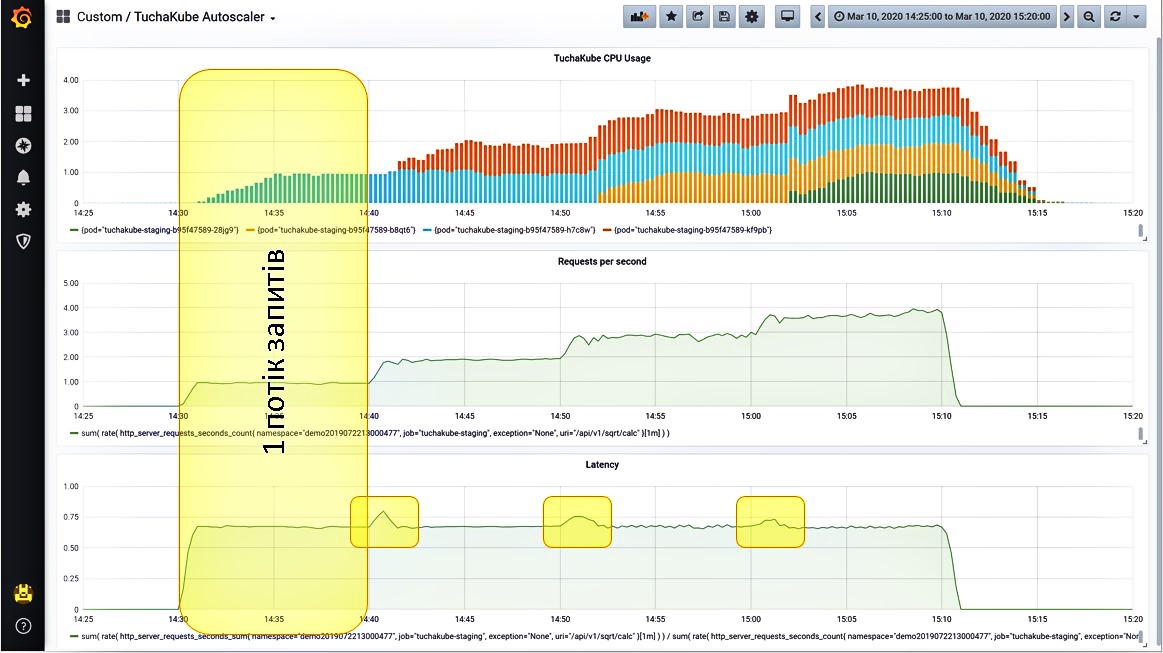
The load starts to grow. Since this indicator is measured 1 time in 5 minutes, in fact, it does not grow as gradually as the graph shows, but a little faster.
So, after the number of requests per second increased, the application began to process these requests. The built-in metrics server shows a certain amount of time required to process a request
Situation 3. We give another stream of requests.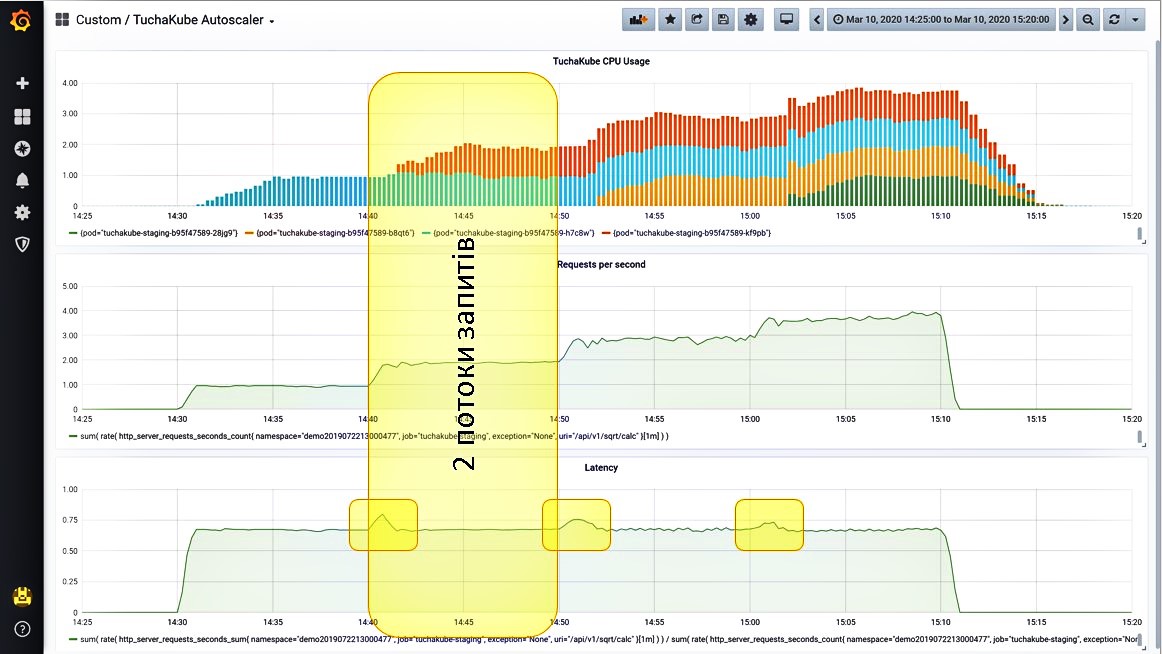
The load starts to grow, and the system monitors it. It also sees that the number of requests per second has increased. Now the system launches the second container (red bars on the graph).
Let us look at this process in more detail. At first, this happened: the delay for processing one request increased slightly, but it was immediately balanced thanks to another container that started.
Situation 4. We give more requests.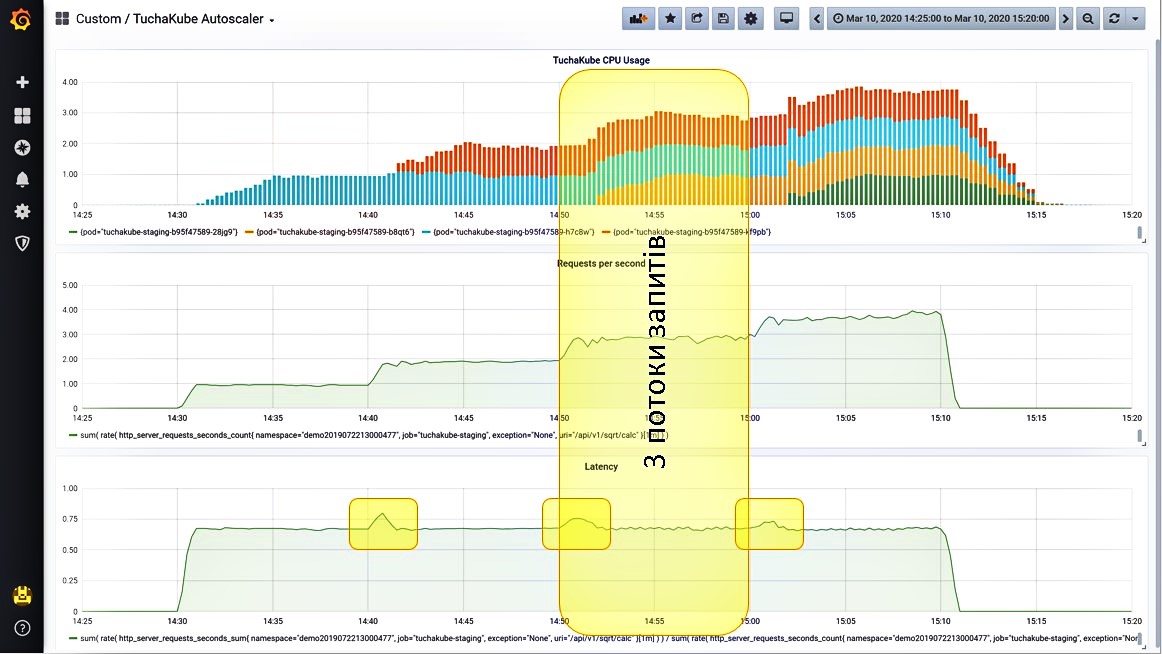
We continue to add a third stream of requests. The system observes that the load is growing and launches another container. The number of requests per second has increased. At the same time, the delay increased again for a brief time, but then its indicator decreased again.
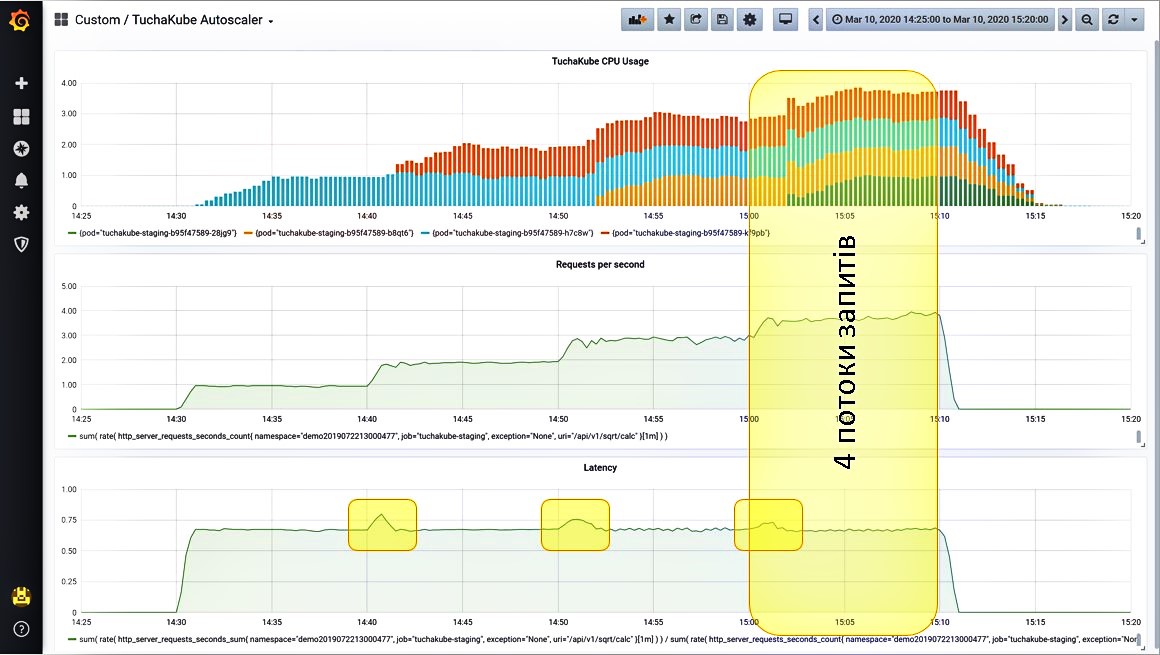
The system "experiences" the fourth stream of requests just as wonderfully, because at the same time the container started up again. At first, the delay indicators increased slightly, but then they reached the level we needed again.
Situation 5. Turning off all requests.
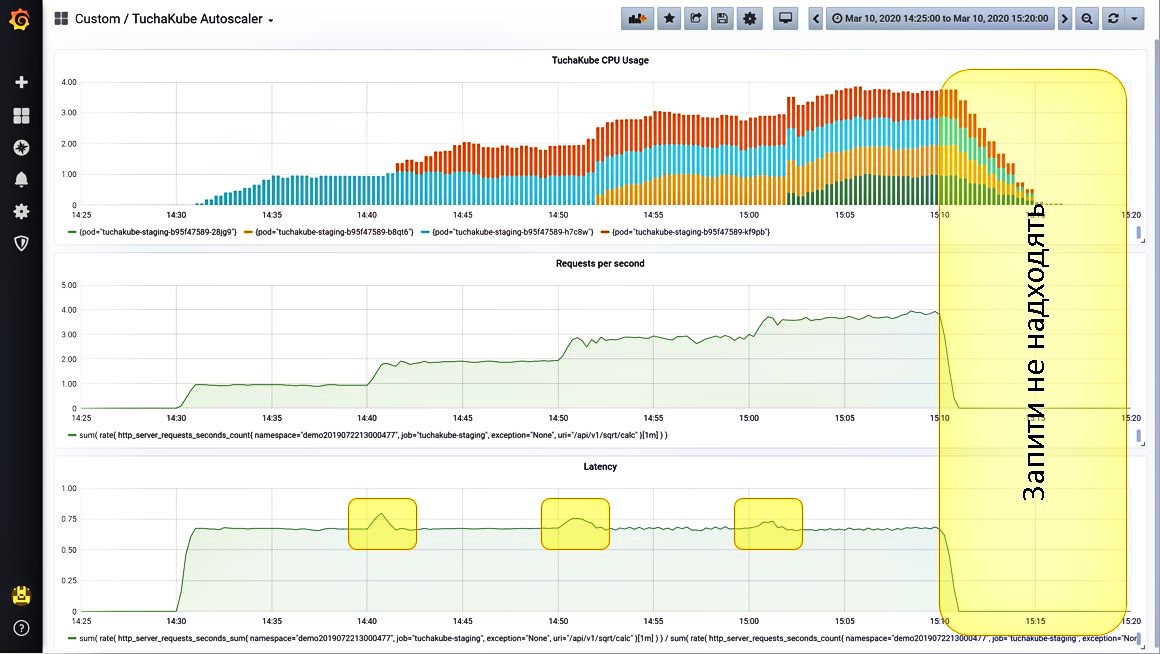
After we have turned off all requests (this is set by separate settings), we see that the load has dropped. Next, the extra containers are removed from Kubernetes in order not to create an additional load for clients and not to charge for resources that the client does not need.
Situation 6. And if you turn on all 4 request streams at once?
This procedure can also be performed. The platform will process them in the same way: at first, the load indicators will increase slightly, but the system will immediately notice this and quickly launch all 4 containers.
This is how horizontal scaling happens, which can be monitored.
Basically, our databases are separate clusters that work outside Kubernetes on separate servers, virtual or physical. But between them and the application, there is a ring of proxy containers that act as request balancers between the customer's application and the database cluster. Databases can be different.
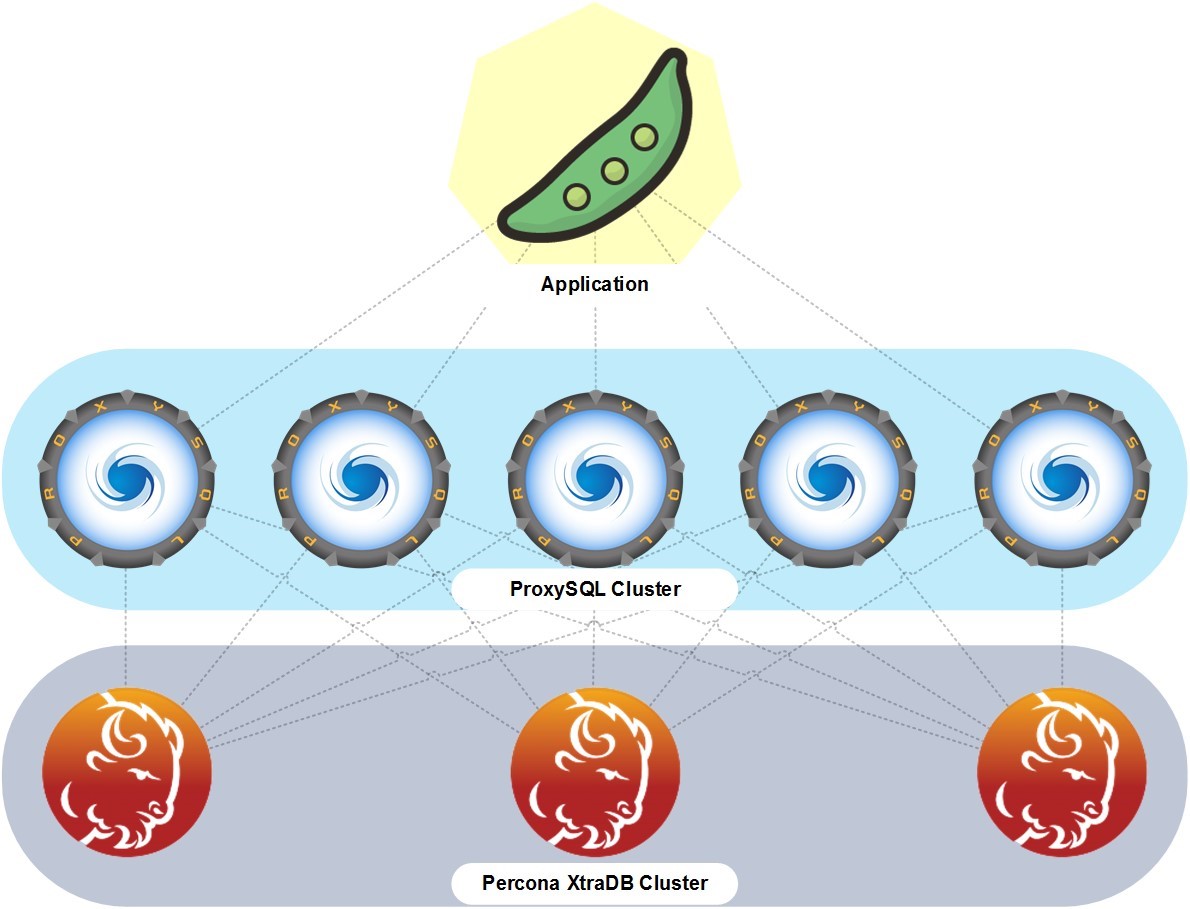
The customer can manage databases, for example, using phpMyAdmin, if we are talking about MySQL-compatible databases, which we also install and configure. We usually create a cluster of database servers to ensure continuity and fault tolerance.
Reliable technical support is a vital component of the platform TuchaKube. Our team of specialists works 24x7 and makes every effort to ensure that each client receives high-quality service and qualified assistance in solving cloud tasks.
Although the Tucha support service operates according to fairly strict regulations. The main thing for us is the complete satisfaction of the client with the services they order. Therefore, we are attentive, take tasks of our customers responsibly, and are interested in their quick and conscientious resolution. This is one of the key features of our technical support service, which gives customers the maximum benefit from cooperation.
The platform TuchaKube is an innovative solution that greatly simplifies software development processes, helps to build highly loaded IT systems, and automate CI/CD processes.
The uniqueness of the service lies in the combination of many components and many powerful features: horizontal scaling, monitoring, collection and storage of statistical data, clustering, and others. And the main advantage is the best support from experienced Tucha DevOps engineers.
If you have a web project that is already working and for which the platform's capabilities would be useful, we invite you to test it! And if you want to learn more about the service or you have real tasks for us, call +380 44 583-5-583 or write to the email address support@tucha.ua. We are always in touch, ready to answer your questions, and choose the best cloud solution for you. Please contact us!


